
United States
Department of
Agriculture
Rural Business-
CgccyE&ive
FIBS
Research
Report 154
USDA
=a
Analysis of
Financial Statements:
Local Farm Supply,
Marketing Cooperatives

This report analyzes the balance sheets and income statements of local farm supply
and marketing cooperatives, comparing 1995 and 1994 and trends over the past 10
years. The data in this report represent four cooperative sizes and types. Common
size income statements and balance sheets are used to compare different cooperative
sizes and types. Trends for major balance sheet and income statement items and ratio
analysis are used to compare and contrast cooperatives by size and type.
Key words: Cooperatives, balance sheet, income statement, farm supply, marketing,
sales, and financial ratios.
Analysis of Financial Statements:
Local Farm Supply, Marketing Cooperatives
E. Eldon Eversull and Beverly L.
Rotan
Rural Business-Cooperative Service
U.S. Department of Agriculture
FIBS
Research Report 154
March 1997
Price: Domestic-S4.50;
Foreign-$500
Preface
This report studied the financial statements of local cooperatives, comparing 1995,
1994, and the past 10 years. Trends of major balance sheet and income statement
items as well as financial ratios are presented for four cooperative sizes and types. The
information provides cooperative managers and boards of directors with a basis to
compare their cooperatives’ historical performance with representative cooperative
data.
The authors thank the cooperatives that provided their financial statements to
RBS-Cooperative Service (CS) and made this report possible. Special thanks to CS
staffers David S. Chesnick and Charles A. Kraenzle for reviewing the initial draft.

Contents
Highlights . . . . . . . . . . . . . . . . . . . . . . . . . . . . . . . . . . . . . . . . . . . . . . . . . . . . . . . .
..~i
Profile of Respondent Cooperatives
.....................................
.l
Balance Sheet Definitions
.............................................
.3
Analysis of the Balance Sheet
.........................................
.4
Description of the Income Statement
....................................
.9
Analysis of the Income Statement
.....................................
.l
1
Financial Ratio Analysis
.............................................
.17
Summary and Conclusions
...........................................
.22
Bibliography
.....................................................
..2 3
Appendix..........................................................2
4
ii

Highlights
Financial statements of 1,610 local farm supply and marketing cooperatives were used
for this report. The statements of 432 cooperatives were used to compare 1995 to
1994, while 1,610 cooperatives were used to look at trends over the past 10 years.
Cooperatives were divided into four groups based on their mix of net sales between
supplies sold and farm products marketed. They were also divided into four size cate-
gories, based on their total sales volume.
Average net income increased 14 percent from 1994 to 1995. In 1995, average net
sales for all cooperatives studied was $12.2 million, up 8 percent from 1994. More than
36 percent of the cooperatives studied were small cooperatives-sales of less than
!§5
million.
Cooperatives not only were important to their member/patrons, but also were an impor-
tant asset to their rural communities. They were probably one of the community’s larg-
er employers, employing an average 21 full-time and 9 part-time employees with an
average annual payroll of $707,000.
Petroleum products and fertilizer were the two principal farm supplies sold. Marketing
activities (mainly grains and oilseeds) provided more than 54 percent of sales for these
cooperatives.
Average total assets grew 17 percent between 1994 and 1995, fueled by large increas-
es in inventories. To finance the growth in assets (mainly inventories), total liabilities
grew 31 percent while owner equities increased 5 percent.
Interest expenses, although less than 1 percent of net sales, increased 42 percent
largely due to increased short-term debt used to finance inventory buildup. Local sav-
ings was down 24 percent, but with an increase of 37 percent in patronage refunds
received, net income for these cooperatives was up 14 percent.
Financial ratio analysis was used to look at 1 O-year trends for the 1,610 cooperatives
in the data base. The financial ratio analysis revealed these findings:
l
The current ratio (current assets/current liabilities) was fairly steady around 1.5
between 1988 and 1994, with a slight downturn in 1995. The quick ratio (current
assets-inventory/current liabilities) mimicked the current ratio’s trend.
. Total debt-to-asset ratio was 0.25 in 1995, higher than most recent years but lower
than the high of 0.3 in 1985.
l
The fixed-asset-turnover ratio, a measure of asset utilization, has averaged at least
9.1 for the past 3 years
(
i.e., net sales were 9.1 times property, plant, and equipment
levels).
l
Return on total assets measures the rate of return on total investments. At 8 percent,
this measure was down slightly from 1994.
l
Return on allocated equity before taxes has grown dramatically in the decade from 5
percent to 14 percent.
.
.
.
111

Analysis of Financial Statements:
Local Farm Supply, Marketing Cooperatives
E. Eldon Eversull and Beverly L.
Rotan
Rural Business-Cooperative Service
U.S. Department of Agriculture
L
ocal
agricultural cooperatives play a vital role in
providing goods and services to their patrons
and the rural community. This report analyzes
their financial statements for comparative purposes for
cooperative managers, directors, and members. Ratio
analysis and trends will be discussed. The presentation
is sub-divided into four cooperative sizes and types to
make the information more useful.
The 432 local cooperatives had farm supply sales
(petroleum, fertilizer, feed, etc.) that averaged $5.6 mil-
lion in 1995 while marketing sales (corn, wheat, soy-
beans, etc.) averaged $6.6 million. Income from ser-
vices (product delivery, fertilizer application, grains
and
oilseeds
hauling and storage, etc.) averaged SO.4
million per year.
These cooperatives were not only important to,
their member/patrons, but also an important asset to
their rural communities. The cooperatives paid an
average of $43,000 in annual property taxes. They were
also a large employer in their communities, averaging
21 full-time and 9 part-time employees with an aver-
age annual payroll of $707,000.
Cooperative annual reports generally contain the
balance sheet and a statement of operations. More
detailed reports may contain a statement of changes in
patrons’ equity and a statement of cash-flows along
with explanations detailing various aspects of the
financial statements. The manager and the president of
the board of directors may also provide a statement on
the cooperative’s past year operating results and
future plans. This study focuses on the balance sheet,
income statement, and financial ratios derived from
these statements.
Profile of Respondent Cooperatives
Staff of the Cooperative Services
(CS)
program in
USDA’s Rural Business-Cooperative Service annually
survey farmer cooperatives. Data from this survey are
used in this study. To be included, a cooperative had to
sell some farm supplies. No cooperative that exclusive-
ly markets members’ products was included. In addi-
tion to selling farm supplies, the cooperative also had
to provide an annual report that had a detailed income
statement.
There are 1,610 cooperatives in the CS Farm
Supply and Services
(FSS)
database. This report focus-
es on 432 cooperatives that provided information in
both 1995 and 1994 when comparing those years and
on all 1,610 cooperatives when looking at long-term
trends (1985 through 1993
‘)
in the financial ratio
analysis section. To obtain a more complete under-
standing of the local cooperatives’ business, informa-
tion in this report is divided into a cross section of four
sizes and four types.
Cooperative Size
Cooperatives were grouped into four sizes by
sales volume, using actual figures. No attempt was
made to deflate these values. Sales groupings used in
this report were the same as in prior reports (see
CS-
RR 134 and RR 138) and, for the 432 cooperatives, sizes
and types used are summarized in table 1.
1
The data in the FSS database does not include 1991. It was omitted
in an effort to disseminate information in a more timely fashion.
At the time, it was thought that information from 1991 would be
included in the future, but as that information became less and less
current, it is less likely to become part of the database.
1

In classifying by total sales alone, product mix
was ignored. For example, a cooperative with $10 mil-
lion in sales that exclusively marketed grains and
oilseeds could be considered small relative to most
grains and oilseeds marketing organizations. But, a
strictly farm supply cooperative with sales of $10 mil-
lion, however, was quite substantial.
Cooperative Type
To account for differences in operations and ori-
entation based on product mix, cooperatives were
grouped into one of four descriptive categories: 1)
farm supply; 2) mixed farm supply; 3) mixed market-
ing; and 4) marketing. These descriptions were chosen
to represent business operations of these cooperatives
as closely as possible and their definitions summarized
in table 1.
This report focuses on cooperatives handling
farm supplies-42 percent in 1995 sold only farm sup-
plies; 16 percent were mixed; 24 percent were mixed
marketing; and 18 percent were marketing (table 2). Of
Table
r-Size and type definitions used for respondent
cooperatives
Cooperative size Definition
Number
Small up to $5 million in total sales
156
Medium
$5 million to $10 million
103
Large
$10 million to $20 million
96
Super $20 million and more
75
Cooperative type
Farm supply total net sales from farm supplies’
161
Mixed farm supply from 50 to 99 percent
70
Mixed marketing from 25 to 49 percent
103
Marketing less than 25 percent
78
1
The definition of farm supply cooperatives differs from prior reports.
These cooperatives now have 100 percent farm supply sales
instead of 90 to 100 percent.
the respondents, 36 percent were small; 24 percent,
medium; 23 percent, large; and 17 percent, super. Both
types of marketing cooperatives tended to be larger
while the farm supply cooperatives were most often
small. Most respondents were small farm supply coop-
eratives.
The first part of this report focuses on the 432
cooperatives that provided information in both 1995
and 1994. In the financial ratio analysis sections, data
between the years were not completely comparable in
that the same cooperatives did not respond to the CS
survey every year. Information in the FSS database
was not randomly selected and may not be statistically
valid to draw industry-wide conclusions. However,
the samples are large and represent a cross section of
cooperatives selling farm supplies and marketing
grains and oilseeds throughout the United States.
The information in this report also goes beyond
432 cooperatives and rural communities. These coop-
eratives operated 643 branches and had a significant
business impact on 1,075 rural communities in terms
of taxes and employment (table
3).
Super cooperatives
that averaged almost five branch outlets impacted
more rural communities. Marketing cooperatives had
an average of two branch outlets.
Sales Mix
The respondent cooperatives had five major farm
supply and two marketing categories (table 4).
Petroleum was the dominant production supply item
sold by small and medium cooperatives. Sales of small
cooperatives, the most numerous, averaged $2.8 mil-
lion in 1995. Farm production supplies represented the
bulk (86 percent) of their sales. As cooperatives grew
in size, the importance of farm supplies declined (64
percent for medium-sized cooperatives, 52 percent for
large, and 32 percent for super).
Table
z-Respondent cooperatives by size and type
Cooperative size
Cooperative type
Small Medium
Large
Super
Total
Number
Percenf
Farm supply
122
37
19 3
41.90
Mixed farm supply
14
23
22
11
16.20
Mixed marketing
12
28
33 30
23.84
Marketing
a
15
24
31
18.06
Percent of total
36.11
23.84 22.69
17.36
100.00

Sales of mixed farm supply cooperatives aver-
aged $12 million with $5 million in farm supply sales.
Petroleum was the most important farm supply item
sold, with feed a close second.
Average sales of marketing and mixed marketing
cooperatives were $22 million and $18 million, respec-
tively, and much larger than both categories of farm
supply cooperatives. As defined, marketing made up
the majority of their sales. Feed, fertilizer, and crop
protectants were the most important farm supplies
sold for both types of marketing cooperatives.
Balance Sheet Definitions
Balance sheet assets represent what the coopera-
tive owns and are usually listed in decreasing order of
their liquidity--the time it would take to convert them
to cash. Liabilities, or what the cooperative owes to
others, are usually presented in a similar decreasing
order. Equity represents members’ investment in their
cooperative.
Current assets- These are the most liquid assets on
the cooperative balance sheet. Cash and cash equivalents
represent monies either in the bank, in short-term
investments, or on hand at the cooperative. Accounts
receivable is money due the cooperative (i.e., a credit
sale due from the customer in 90 days). Inventories are
products the cooperative has purchased from patrons
to market and supplies the cooperative hopes to sell to
patrons. Prepaid expenses are those paid up-front and
then expensed as period costs throughout the fiscal
year (i.e., taxes or insurance).
Investments in other cooperatives-
represent equity
held in regional cooperatives through whom local
cooperatives market products or purchase supplies
and equity in the Bank for Cooperatives or CoBank,
their lending source. These investments are purchased
Table
z+-Average
and total number of branches
Cooperative
type
Average
Farm supply
.92
Mixed farm supply
1.79
Mixed marketing
1.78
Marketing
2.33
All
1.43
Total
55
122
178
177
643
Cooperative size
Average Total
Small
.36
55
Medium
.95
96
Large
1.59
153
Super
4.52
339
Table
&Average farm supplies sold and products marketed as a percent of
tOtSI
Saks,
and change from 1994
to 1995
Item
1995
1994
change, 1994
to 1995
Percent
Farm supplies sold:
Feed
9.22
10.17
1.48
Seed
.90
.98
3.05
Fertilizer
10.45
10.44
12.10
Crop protectants
7.42
7.87
5.52
Petroleum products
12.64
13.20
7.23
Other
4.91
5.29
3.04
Total
45.54
47.95
6.33
Products marketed:
Grains and oilseeds
53.79
52.05
25.59
Other
.67
-
-
Total
54.46
52.05
9.10
Total sales
100.00
100.00
11.96
Based on sales of:
$12,203,699 $10,900,239
3

equity as well as equity (patronage) paid back to the
cooperative based on use. The more sales through or
purchases from the regional cooperative or borrowing
from the bank, the larger the investment. Other assets
are usually past due accounts receivable not yet con-
sidered as bad debt losses.
Property, plant, and equipment- are the fixed assets
of the cooperative (i.e., grain bins, office equipment,
warehouse, gas station).
Accumulated depreciation
is the
sum of all the year’s depreciation expenses taken on
the assets. Net
property, plant,
and equipment
(PPQE)
is
the book value of the fixed assets-their cost minus
accumulated depreciation.
Total assets- are what the cooperative owns-current
assets, plus investments, plus net fixed assets equal
total assets.
Current liabilities- are obligations the cooperative
must pay within the next year.
Accounts payable
is
money owed, usually to suppliers (sometimes classi-
fied as accounts payable-trade accounts).
Accrued
expenses
and
accrued taxes
are unpaid expenses. They
often include unpaid salaries and benefits earned by
employees. Accrued taxes often include property and
sales taxes that have been incurred but not yet paid.
Other liabilities
in this study are most often accounts
payable-grains and
oilseeds
delivered and sold to the
cooperative by its patrons who have not yet been paid.
Retired equity
represents allocated equity that the board
has approved to revolve to members but not yet paid
as of the closing date of the books. This equity accu-
mulated from past sales to or purchases from
patrons-usually revolved to members on a set sched-
ule (often 7 or more years later).
Patronage refunds and
dividends
are monies declared but not yet paid to mem-
bers for current use of the cooperative and for invest-
ing in preferred stock.
Cooperatives are required to pay at least 20 per-
cent of their refunds in cash, with the rest becoming
allocated equity to be revolved to the members at a
later date. The refunds are based on cents per product
(weight or bushel) sold and/or on a percent of the dol-
lars of farm supplies purchased. The refunds are deter-
mined by the board of directors. Dividends paid on
preferred stock ownership are based on a set percent
return on the investment.
Current portion of
Zong-term
debt
and
seasonal short-term debt
are the final current lia-
bilities. They are money owed (principal) for borrow-
ing money and for leases. Long-term debt typically is
used to finance long-term assets, while short-term debt
is usually used for operating or seasonal loans.
Long-term
debt-
includes notes, bonds, mortgages,
and leases not due within the current year.
Member equities- are member and patron invest-
ments in the cooperative. The two main types are allo-
cated and unallocated.
Allocated equity
is assigned to
members in one of two forms. Each member has one
share and one vote. The other form includes
noncash
allocated certificates which are member investments in
the cooperative based on use.
Allocated equity could be classified as stock if the
cooperative was incorporated or certificates of owner-
ship if not incorporated. In most cases, cooperative
stock or ownership certificates are not generally traded
between members and, if sold, require board approval.
Unallocated equity
is the retained earnings of the cooper-
ative and often thought of as
nonmember-nonpatron-
age business but can also be based on member business.
Analysis of the Balance Sheet
The balance sheet of a local cooperative states its
financial position at the end of an operating period-a
1Zmonth fiscal year. The balance sheet represents the
cooperative’s assets, liabilities, member equity, and
their relationship to each other. This report analyzes
the balance sheets of 432 local cooperatives to provide
examples of typical levels for assets, liabilities, and
member equities for different sizes and types.
Table 5 compares common size balance sheets for
all respondents for 1995 and 1994. Appendix tables l-4
show common size balance sheets by size and type for
1995. In a common size balance sheet, each account is
listed as a percentage of total assets. The dollar
amount of total assets the balance sheets represent is
listed at the bottom of the table. By cooperative size,
total assets increased from $1.5 million for small coop-
eratives to $16.2 million for super-size cooperatives
(table 7). By cooperative type, total assets were $2.7
million for farm supply,
$6.2
million for mixed farm
supply, $7.8 million for mixed marketing, and $9 mil-
lion for marketing (table
8).
Current Assets
Looking first at current assets, cash and cash
equivalents as a percent of total assets decreased as
cooperative size increased. For small cooperatives,

cash was 7.4 percent of total assets. But, this dropped to
From 1994 to 1995, current assets increased by 24
1.9 percent for super cooperatives. Farm supply cooper-
percent. Most of this growth occurred in inventories,
atives
held the most cash by type (5.3 percent), followed
principally grains and oilseeds inventories. Overall,
by mixed farm supply cooperatives (2.8 percent).
these inventories increased 51 percent and farm sup-
Table
&Common size balance sheet and change in accounts, 1994 to 1995
1995
1994 Percentage change
Assets
Current assets
Cash
and
cash equivalents
Accounts
receivable
Inventories--grains and
oilseeds
-farm supplies
Prepaid expenses
Other current assets
Percent
3.12 4.69 (22.33)
10.95 11.89 7.22
22.36
17.23
51.23
11.83 11.52 19.70
0.92
1.21
(11.42)
7.41
6.48
33.18
Total current assets
Investments and other assets
investments-other cooperatives
-Bank for Cooperatives
56.59
53.02 24.37
16.79 18.42
6.18
1.43
1.18
40.98
-total
18.22
19.61
6.28
Other assets
.96 .88
27.28
Total investments
8
other assets
Property, plant, and equipment
At cost
Less accumulated depreciation
19.18
20.49
9.10
64.14
68.69
8.79
39.91
42.20
10.21
Net
PP&E
24.23
26.49
6.54
Total assets
100.00 100.00 16.52
Liabilities and owner
equities
Current liabilities
Current portion of long-term debt
Notes payable-seasonal
Accounts payable
Patrons credit balances
&
other liabilities
Accrued taxes
Accrued expenses
Patronage refunds (cash)
3.23
3.46 8.75
16.45 11.15
71.68
5.21
6.48
(8.20)
14.64
12.94
31.83
.64 .73
3.55
1.52
1.50 17.85
1.21
1.23 15.46
Total current liabilities
42.91
37.48 33.39
Long-term debt
6.82
6.84
16.31
Total liabilities
49.73
44.32 30.76
Owner equities
Allocated equity
Unallocated equity
37.03 41.76
3.30
13.24 13.92
10.83
Total owner equities
Total liabilities and owner equities
Based on total assets of:
50.27
55.68
5.18
100.00 100.00
16.52
!$5,630,189
$4,832,085
5

plies nearly 20 percent. By size, farm supply invento-
ries increased about 10 percent more for large and
super cooperatives and by type, about 5 percent more
for both farm supply cooperatives. Grains and oilseeds
inventories increased more than 55 percent for medi-
um and super cooperatives. By type, they increased
more than 50 percent for all but farm supply coopera-
tives.
There were also regional differences in inventory
buildup. By looking at 103 cooperatives that had their
grains and oilseeds inventories increase more than 50
percent, 65 cooperatives were in Iowa, Minnesota, or
Nebraska. In dollar terms, inventory increased $178
million, with $128 million in these three States. Part of
this buildup was due to low grains and oilseeds prices
the prior year and farmers holding back sales.
But a grain railcar shortage in the upper Midwest
also forced some cooperatives to resort to outdoor
storage on the ground (with increased grain prices and
especially corn prices, inventories of grains and
oilseeds can be expected to be much lower in
FY
96).
Interest expenses in the three States increased by $7
million, in part to finance these inventories. Local sav-
ings fell $10 million and 30 cooperatives had losses in
local income. Net income was up 16 percent for these
cooperatives due to patronage refunds, so that only
nine experienced losses.
Accounts receivable in this study were farm sup-
ply trade accounts, not grains and oilseeds trade
receivables. Farm supply and grains and oilseeds trade
receivables (“other” current assets) were separated to
allow ratio analysis in a future section of this study.
Accounts receivable for farm supply sales increased 7
percent, growing at about the same rate as the increase
in farm supply sales.
The age of accounts receivable refers to how long
ago the sale that started this receivable was made.
Most cooperatives have credit sales with discounts
offered to promote prompt payment. Terms might be 2
percent-10 days, net 30 days (no discount). Discounts
might be offered on all farm supply sales or on certain
products. The terms and what products had discounts
were not known, but 96 cooperatives listed their dis-
count on sales, and it was 1.22 percent on total farm
supply sales.
The age of accounts receivable is known for 54
cooperatives for both years (table 6). Fifty-five percent
were current. Another 14 percent were from 31 to 60
days old. The largest difference between the 2 years
was nearly 12 percent of receivables were more than 6
months old compared with 8 percent in 1994.
Table
6
Age
of
SCCOUM
receivable,
1995
and
1994
Accounts receivable age
1995
1994
Percent
Current, 0 to 30 days
55.02 53.15
31 to 60 days
14.26 14.77
61 to 90 days
8.69 10.55
91 to 120 days
1.96
4.70
121 to 180 days 3.10 3.72
Greater than 6 months
11.63 7.70
Accounts written off this
period 5.34
5.41
Based on accounts receivable of:
$26,284,134
$24,160,885
Investments and Other Assets
About 1.4 percent of cooperative’s total assets
was invested in the Bank for Cooperatives or CoBank.
Larger cooperatives and both types of marketing coop-
eratives had comparable investments. Meanwhile,
investments in other cooperatives dropped from a high
of 26 percent for small cooperatives to 13 percent for
super cooperatives. Across types, marketing coopera-
tives had less invested than farm supply cooperatives.
Other assets often included overdue accounts receiv-
able and were generally less than 2 percent of total
assets for all cooperative sizes and types (except large
farm supply cooperatives, 4.2 percent).
Property, Plant, and Equipment
Net property, plant, and equipment
(PP&E)
as a
percent of total assets tended to be between 22 percent
and 26 percent for all cooperative sizes. Net PP&E
increased 6.5 percent from 1994. Cooperatives that
handled grains and oilseeds had higher dollar
amounts of PP&E, probably due to extensive grains
and oilseeds storage and handling facilities and, also,
because these cooperatives were larger than farm sup-
ply cooperatives. But, both farm supply cooperatives
had growth in net
W&E
of at least 9 percent while
both marketing cooperatives were less than 5.5 per-
cent.
Current Liabilities
Current liabilities grew 33 percent between 1994
and 1995. The largest increase was in notes payable-
seasonal used to finance current operations, and usual-
ly used for inventories, They grew from 11.2 percent of
total assets to 16.5 percent. Farm supply cooperatives
had a negligible change while mixed farm supply,
mixed marketing, and marketing cooperatives all were
up 5 percent.

Table
7%Common
size balance sheets by cooperative size, 1995
Small Medium
Large Super
Assets
Current assets
Cash and cash equivalents
Accounts receivable
Inventories-grains and
oilseeds
-farm supplies
Prepaid expenses
Other current assets
7.41
13.10
3.29
20.23
2.15
3.93
Percent of
fofal
assets
4.59 3.03
14.05 11.96
11.38 18.46
14.11
12.68
64
63
5.07 6.54
1.93
9.07
31.21
9.15
.77
9.21
Total current assets
Investments and other assets
Investments-other cooperatives
--Bank for Cooperatives
50.11 50.04
53.50 61.34
26.20
22.51
17.95
12.72
.37
1.39
1.41
1.65
-total
26.57 23.90
19.36 14.37
Other assets
1.15
1.40 1.50
.53
Total investments
&
other assets
Property, plant, and equipment
At cost
Less accumulated depreciation
27.72
25.30 20.86
14.90
60.87
67.77
71.20
60.07
38.70
43.11
45.57
36.30
Net
PP&E
22.17 24.66 25.64 23.76
Total assets
100.00 100.00 100.00 100.00
Liabilities and owner equities
Current liabilities
Current portion of long-term debt
Notes payable-seasonal
Accounts payable
Patrons
credii
balances
&
other liabilities
Accrued taxes
Accrued expenses
Patronage refunds (cash)
Total current liabilities
Long-term debt
Total liabilities
27.86 37.73
47.11
58.76
Owner equities
Allocated equity
Unallocated equity
1.76 3.05
4.11
3.12
6.35 9.29 13.09
22.19
6.38
5.88 6.09
4.35
6.19 9.13 12.94
18.74
.44
.55 .65
.71
1.30 1.42 1.65
1.52
1.31
1.38
1.31
1.10
23.73 30.70 39.84 51.73
4.13 7.03
7.27
7.03
53.64 45.70 39.58 30.02
18.50 16.57
13.31
11.22
Total owner equities
72.14
62.27 52.89
41.24
Total liabilities and owner equities
Based on total assets of:
100.00 100.00 100.00
100.00
$1,460,910
$3,558,985 $8,316,485 $16,249,985
7

Table
s-Common
Size
balance sheets by cooperative type, 1995
Farm supply Mixed farm supply
Mixed marketing
Marketing
Assets
Current assets
Cash and cash equivalents
Accounts receivable
Inventories-grains and oifseeds
-farm supplies
Prepaid expenses
Other current assets
Total current assets
Percent of total assets
5.34
2.78
2.66
2.30
13.59 15.15
10.41
7.09
0.00 16.32
27.53
35.66
23.11 12.33
9.79
6.16
2.05
.65
.68
.57
2.69
3.85
8.64
11.51
46.78
51.08
59.71
63.29
Investments and other assets
Investments-other cooperatives
-Bank for Cooperatives
25.47
19.77
14.66 11.30
.72
1.39 1.67
1.69
-total
26.19
21.16
16.33 12.99
Other assets
2.12
1.31
.36
.63
Total investments
&
other assets
Property, plant, and equipment
At cost
Less accumulated depreciation
Net
PP&E
28.31
22.47
16.69 13.62
58.84
68.75
69.64
58.78
33.93
42.30 46.04
35.69
24.91
26.45
23.60 23.09
Total assets
100.00
100.00 100.00 100.00
Liabilities and owner equities
Current liabilities
Current portion of long-term debt
Notes payable-seasonal
Accounts payable
Patrons credit balances
&
other liabilities
Accrued taxes
Accrued expenses
Patronage refunds (cash)
2.00 3.14
3.36
4.00
6.79 15.67
18.91
20.90
7.66 6.34
4.35
3.78
5.27
7.06 16.47
23.78
.51
.55
.76 .67
1.86
1.88 1.54
1.03
1.62
1.51
1.23 0.74
Total current liabilities
Long-term debt
Total liabilities
Owner equities
Allocated equity
Unallocated equity
Total owner equities
Total liabilities and owner equities
Based on assets of:
25.71
36.15
46.62
54.90
7.42
7.81
5.97 6.77
33.13 43.96
52.59 61.67
52.05 45.05
32.67 26.52
14.82
10.99
14.74
11.81
66.87
56.04 47.41
38.33
100.00 100.00
100.00 100.00
$2,731,412
$6,180,969
$7,762,383 $9,046,959
8

Patrons’ credit balances and other liabilities grew
by 32 percent, mostly due to the inclusion of payables
due on grains and oilseeds trading and other market-
ing activities.
Accrued expenses and patronage refunds were
the only other current liabilities that grew in double
digits. Accrued expenses grew by 17.7 percent and
were a slightly larger percentage of total assets for
larger cooperatives and for both types of farm supply
cooperatives. Cash patronage refunds and dividends
grew by 15.5 percent, but was less than 2 percent of
total assets for all sizes and types of cooperatives.
Long-term Debt
Long-term debt increased by 16.3 percent from
1994 to 1995. As a percent of total assets it generally
increased with cooperative size, but interestingly,
tended to be higher for both types of farm supply
cooperatives. By type as a percent of total assets, long-
term debt ranged from 6 percent to 7.8 percent with
the farm supply cooperatives at the high end, about a
percentage point higher than the marketing coopera-
tives. Twenty-nine percent of the cooperatives had no
long-term debt. About half were small farm supply
cooperatives and combined together, farm supply
cooperatives made up more than half.
Nearly 66 percent of the cooperatives provided
information that broke out four main sources of their
$500 million total debt (short- and long-term com-
bined)-Bank
for Cooperatives and CoBank, commer-
cial banks, debentures or notes, and other.
A regional cooperative was most often the source
in the “other” category. The local cooperative often
purchases its farm supplies and markets its grains and
oilseeds through a regional cooperative, which
becomes a source of debt capital. The debt may be
short-term operating capital or long-term investment
capital.
Bank for Cooperatives and CoBank were the
most frequent source of debt capital (59 percent).
Others were regional cooperatives (32 percent), deben-
tures or notes (5 percent), and commercial banks (4
percent). Most sources, except debentures and notes,
extend lines of credit. Only 90 cooperatives reported
their lines of credit for both years, but in total it
increased by $20 million to $308 million in 1995. Of
this line of credit, the unused portion fell by $20 mil-
lion to $166 million in 1995.
Member Equities
Member equities to total assets represent the per-
cent of the cooperative’s assets owned by the mem-
bers, with creditors claiming the rest. Over all sizes
and types of cooperatives, members averaged 50.3 per-
cent ownership of the cooperative, down from 55.7
percent in 1994.
Members of small cooperatives had the highest
percentage of ownership (72.1 percent) while members
of super-size cooperatives had the lowest (41.2 per-
cent). By cooperative type, members of mixed farm
supply cooperatives owned at least 56 percent of their
cooperatives’ assets while farm supply cooperatives’
members owned more than 66 percent. Both types of
marketing cooperatives had lower member owner-
ship-38.3 percent for marketing and 47.4 percent for
mixed marketing cooperatives.
Member equities consisted of both allocated (pre-
ferred, common, and other kinds of ownership certifi-
cates) and unallocated equity. Allocated equity as a
percentage of total assets was highest for small cooper-
atives at 53.6 percent and more than 45 percent for
both farm supply cooperatives.
Unallocated equity averaged more than 13 per-
cent of total assets for all sizes and types, but fell as
cooperative size increased. By type, unallocated equity
was around 15 percent of total assets for farm supply
and mixed marketing cooperatives and around 11 per-
cent to 12 percent for mixed farm supply and market-
ing cooperatives.
Description of Income Statement
The income statement shows the results of opera-
tions for the past year and usually includes both the
current and prior year. It lists all sources of revenue
and expenses. The statement measures the profitability
of the cooperative for a given period of time. Although
it does not show timing of cash-flows, the statement
best describes the status of the business.
In the analysis of income statements, net sales
were set at 100 percent to find out the proportion that
a single item represented in a total group or subgroup.
Because the income statement variables were
expressed as a percent of net sales, comparisons were
possible between different sizes and types of opera-
tions. Thus, the statement used in this report became
known as a “common size” income statement. This
statement was provided for the average cooperative
respondent in table 9. The first item listed on the
income statement net sales was the primary source of
revenue-farm supplies sold and products marketed.
Cost of goods sold (COGS) was the amount a
cooperative paid for the products it sold and market-
9

Table
9-hICOI?W
Statt?t?Wnt
and change in
SCCOUntS,
19%
t0
1995
1995 1994
Percent change
Net sales
Cost of goods sold
Gross margin
Service and other income
Gross revenue
Operating expenses
Employee:
Salaries and wages
Payroll taxes
Employee insurance
Pension expense
Total
Administrative:
Professional services
Office supplies (includes postage)
Telephone, markets
Meetings and travel
Donations
Dues and subscriptions
Directors’ fees and expense
Annual meetings expense
Total
General:
Advertising and promotion
Delivery (auto
&
truck) expense
Insurance
Property
&
Business taxes
Other taxes and licenses
Rent and lease expense
Plant supplies
&
repairs
Repairs and maintenance
Utilities (includes dryer expense)
Miscellaneous expenses
Other expenses
Total
Depreciation
Interest expense
Bad debts
Total expenses
Local savings
Patronage refunds received
Savings before income taxes
Less income taxes
Net income
Based on sales of:
100.00
90.06
9.94
3.98
13.92
Percent
of
net
sales
100.00
89.87
10.13
3.79
13.92
7.82
8.05
5.83
13.26
7.85
4.69
4.36
15.97
.37
.36
9.31
.49
.50
6.78
.14
.14
12.94
5.69
5.36
7.16
.16
.13
34.45
.16
.16
7.72
.09
.09
7.18
.07
.07
7.52
.Ol
.Ol
9.92
.03
.03
15.51
.03
.03
6.26
.02
.02
3.93
57
.54
13.66
.16
.16
8.81
.68
.63
16.27
.49
.51
2.83
.33
.34
3.55
.15
.17
(4.96)
.20
.20
9.28
.22
.20
21.74
.68
.65
12.85
.49
.51
3.08
.12
.ll
17.21
.32
.39
(14.35)
3.84
3.87
18.00
1.53
1.54
7.33
.89
.68
42.42
.ll
.lO
17.16
12.63
12.09
12.65
1.29
1.83
(23.98)
1.41
1.11
36.55
2.70
2.94
(1.03)
.31
.68
(51 .Ol)
2.39
2.26
14.01
$12,187,025
$11,302,965
10

ed-cost to the cooperative for the supplies sold and
payments to farmers for products marketed. Net sales
less COGS represented the gross margin on sales.
Service and other income came mainly from pro-
viding services to cooperative patrons. Service includ-
ed delivery, chemical and fertilizer application, grain
drying, and storage. Although substantial for some
cooperatives, service income was not considered a pri-
mary source of revenue.
Operating expenses were those incurred in the
course of conducting normal business. They were usu-
ally classified by function like employee, administra-
tive, general, and depreciation, interest, and bad debts.
Local savings resulted from operations before
taxes and patronage refunds from other cooperatives.
Patronage refunds were based on volume of business
conducted with another cooperative and were depen-
dent on the other cooperative’s net income. Usually,
this income was allocated equity and not actual cash
coming into the respondent cooperatives.
Net income was the end result of operations for
that year. Distribution of net income was not part of
the income statement. The board of directors decides
how to distribute net income or allocate a net loss.
Analysis of the Income Statement
The income statement displays the net results of
cooperative operations. Because most managers’ per-
formance is judged by net income, members attach
great importance to the income statement. In the fol-
lowing sections, the underling values of the income
statement are studied. Table 9 presents a common size
income statement for 432 cooperatives and the change
between 1994 and 1995. Appendix tables 5 to 8 show
common size income statements by size and type for
1995.
Net Sales
The first item of the income statement analyzed
in this report was net sales. It was determined by sub-
tracting sales discounts and returns and allowances
from gross sales. The average net sales for the 432
cooperatives in 1995 was $12.2 million, up
$0.9
million
or 7.8 percent from 1994. Net sales by cooperative size
are presented in table 10, and by type in table 11. All
sizes and types of cooperatives experienced a growth
in net sales from 1994. If assets from tables 7 and 8 are
compared to net sales in tables 10 and 11, sales for all
types (except marketing) and sizes are about twice the
level of assets.
Cost of Goods Sold
Cost of goods sold (COGS) represented the
largest single component of expenses, usually
expressed as a percent of net sales. For this study,
COGS includes the beginning inventory plus purchas-
es and freight costs, minus purchase returns and
allowances, purchase discounts, and ending inventory.
So, for these cooperatives, COGS was the purchase
price of the farm supplies sold or products marketed.
Table 11 shows COGS as a percent of net sales for the
different types of cooperatives. Both types of market-
ing cooperatives had a relatively high COGS when
compared with farm supply cooperatives, which was
to be expected because they were generally marketing
grains and oilseeds for their patrons with only a few
cents per bushel margin. There was negligible change
in COGS by cooperative size and type between the 2
years.
Gross Margins
Gross margins were the excess of net sales over
the cost of goods sold. The gross margin averaged 9.9
percent for all cooperatives, down from 10.1 percent in
1994. The gross margin or gross margin percentage is a
very important operating ratio. A small change in the
gross margin has a tremendous impact on local sav-
ings. A cooperative manager must maintain a gross
margin near industry averages. Thus, least cost sources
of supplies need to be developed and marketing coop-
eratives must pay market rates on the products they
purchase.
Cooperatives are often characterized as business-
es that provide goods and services “at cost.” However,
a cooperative cannot operate at cost on a day-to-day
basis. Therefore, unless a cooperative has an adequate
gross margin, it can neither be profitable nor afford to
finance essential future-directed discretionary expen-
ditures such as expansion and advertising.
Because by definition, gross margin equals net
sales less cost of goods sold, those cooperatives with
higher COGS had lower gross margins. COGS were
higher for marketing and larger cooperatives, so gross
margins as a percent of net sales were highest for farm
supply and small cooperatives. Farm supply coopera-
tives-16.7 percent-had the highest gross margin.
Although both types of farm supply cooperatives had
less business volume than those that performed mar-
keting activities, their gross margin percentage was
from 6 to 10 percentage points higher. Small coopera-
tives, mostly selling farm supplies, had the highest
gross margin by size (15.6 percent).
11

Table
w-Abbreviated income statement as a percent of net sales for cooperatives by size, 1995
Small
Medium
Large
Super
Percent of net
sa/es
Net sales
100.00 100.00 100.00 100.00
Cost of goods sold
64.36 67.66
89.08 91.98
Gross margin
15.64 12.34 10.92
a.02
Service and other income
3.63 4.16 4.07 3.94
Gross revenue
19.27 16.50 14.99 11.96
Expenses
Employee
1
9.23 7.22 6.52
4.58
Administrative
*
1.10 .79 .59 -44
General
3
4.35 3.78 3.56 3.35
Depreciation
2.11 1.97 1.74 1.46
Interest
.68 .a2 .90
1.03
Bad debts
.23 .24
.ia
.06
Total
expenses
17.70 14.82 13.49 10.92
Local savings
1.57
1.68 1.50
1.04
Patronage refunds received
2.36
1 .a4
1.49
1.12
Savings before income taxes
3.93 3.52 2.99 2.16
Less income taxes
.24 .42 .49
.20
Net income
3.69 3.10 2.50
1.96
Based on total sales of:
$2,599,834 $7,010,685
$13,819,360 !§37,104,303
t
Employee expenses include salaries and wages, payroll taxes, employee insurance, unemployment compensation, and pension expense.
2
Administrative costs include professional services, office supplies, telephone, meetings and travel, donations, dues and subscriptions,
directors’ fees and expense, and annual meetings.
3
General expenses include advertising and promotion, delivery (auto and truck), insurance, property, business and other taxes and licenses,
rent and lease expenses, plant supplies and repairs, repairs and maintenance, utilities, miscellaneous, and other.
Gross margins vary not only by cooperative, but
also by farm supply sold or product marketed.
Cooperatives, like other businesses, have different
margins for different products. For 100 cooperatives
that provided their individual product gross margins,
these margins are shown in table 12. Margins vary due
to product type and competition. For instance, fertiliz-
er sold by the truckload has a different margin than a
sale of a single bag. The services offered in conjunction
with a sale (e.g., fertilizer spread on the field by a
cooperative truck) have an impact on margin. Margins
are also subject to competition. The gross margin dis-
cussed in the first paragraph of this section is a blend-
12
ed margin, made up of the margins of all products the
cooperative sold, services rendered, and products mar-
keted.
The highest weighted (by volume) gross margin
for the five main farm supplies was for fertilizer with a
gross margin of almost 19 percent. The maximum mar-
gin on fertilizer of 46 percent was for a small amount,
probably a speciality fertilizer sold by the bag. Feed
and petroleum margins were both around 17 percent.
The margin of -302 percent on seed looks incorrect and
needs further explanation. This margin was from a
cooperative with more than
$6
million in grains and
oilseeds sales that sold $1,500 of seed for
$400.
The

Table
I
l-Abbreviated income statement as a percent of net sales for cooperatives by type, 1995
Farm supply Mixed farm supply Mixed marketing Marketing
Percent of net sales
Net sales
100.00 100.00 100.00 100.00
Cost of goods sold
83.32 85.06 91.82 94.02
Gross margin
16.68 14.94 8.18 5.98
Service and other income 3.81
4.99 4.03 3.55
Gross revenue
20.49 19.93
12.21
9.53
Expenses
Employee
l
9.63 8.89 4.85 3.36
Administrative
2
1.02
.91
.44 .33
General 4.67 5.15
2.91
2.87
Depreciation
2.23 2.24
1.54
1.20
Interest .85 1.09 .95 .94
Bad debts .19 -22 .12 .05
Total
expenses
18.59 18.50
10.81
8.75
Local savings
1.90 1.43 1.40
.78
Patronage refunds received
2.39
1.99
1.15
.91
Savings before income taxes
4.29 3.42 2.55
1.69
Less income taxes .23 .20 .49
.21
Net income
4.06 3.22 2.06 1.48
Based on sales of:
!$4,930,596
$11,534,034 $18,014,033 $21,917,039
1
Employee expenses include salaries and wages, payroll taxes, employee insurance, unemployment compensation, and pension expense.
*
Administrative costs include professional services, office supplies, telephone, meetings and travel, donations, dues and subscriptions,
directors’ fees and expense, and annual meetings.
3
General expenses include advertising and promotion, delivery (auto and truck), insurance, property, business and other taxes and licenses,
rent and lease expenses, plant supplies and repairs, repairs and maintenance, utilities, miscellaneous, and other.
seed may have been damaged, stolen, or sold for a
loss, but for whatever the reason, it was a very small
loss on minimal sales,
If the gross margin is extremely low, it may mean
that the cooperative is in a very competitive market.
For example, the two cooperatives with the lowest
margins were located in close proximity and of course,
in head-to-head competition. On further analysis, both
cooperatives have been profitable over the past 5 years
and have increased sales. They have even discussed
merger, but membership has resisted this change. In
this one instance, their low margins may be equated to
low product prices-something that their members
have noted by increasing their purchases from both
cooperatives.
Grains and oilseeds were the only products mar-
keted where gross margins were known. Grains and
oilseeds margins were low, only around 4 percent.
Around 10 cooperatives reported high grains and
oilseeds margins of 18 and 19 percent. These high mar-
gins were all at mixed farm supply cooperatives that
had feed sales. It is suspected that the high margins
resulted from the grain and oilseed content in livestock
feeds sold rather than the commodities themselves.
Service and Other Income
Service and other income, for the most part, con-
sisted of trucking services (both delivery of purchases
to patrons and transfer of their products to market),
custom application of fertilizers and crop protectants,
and drying and storing of grains and oilseeds. Local
13

Table
12--Gross
margin on farm supplies sold and grains and
oilsaeds
marketed,
1995
Weighted
Number of
margin Maximum
Minimum
observations
Percent
Number
Feed 16.53
28.76 2.38
a4
Seed 14.59
64.09
(301 a4)
78
Fertilizer
18.61
45.88 4.14 88
Crop protectants
13.86
24.96 2.66
a4
Petroleum products
16.46
41.23 2.45 55
Tires, batteries,
&
auto accessories 21.04 29.68
1.77
43
Machinery
13.88 19.24 11.09 4
Building materials 21.20
69.51
9.95
16
Food
23.44 33.00
11.71 7
Other farm supplies
19.50
48.35
(10.08)
90
Grains and
oilseeds 4.16
18.81
.27 62
cooperatives provided many other services to their
patrons, but these were the primary ones of the
respondent cooperatives. This income averaged
between 3.6 percent and 5 percent of net sales for all
sizes and types of cooperatives.
Other income was derived from non-operating
sources such as interest and finance charges. This
income included interest on cash equivalents and
interest charged on credit sales.
Other income also came from the sale of property,
plant, and equipment, rentals, and extraordinary
items. Sometimes property, plant, and equipment was
sold to generate income, but usually it was the sale of
a fully depreciated asset where the market value was
greater than the book value. In some cases, disposal of
a fully depreciated asset may mean a loss to the coop-
erative. Rental income from unused facilities or equip-
ment provided income flows. Extraordinary items
might be either a gain or a loss. A gain could result
from a fire loss where the insurance settlement was
greater than the book value of the asset. A loss might
be from flood damage for which the cooperative had
no coverage.
Operating Expenses
Operating expenses were divided into four main
categories-employee; administrative; general; and
depreciation, interest, and bad debts. Employee
expenses, of course, were related to labor costs.
Administrative expenses included a variety of over-
head costs associated with a cooperative and indirectly
related to revenue production. General expenses were
those directly related to revenue production, The bulk
were in employee, general, and depreciation categories.
14
Employee Expenses
Employee expenses included salaries, wages, and
benefits (payroll taxes, employee insurance, unem-
ployment compensation, and pension expense) and
averaged 5.7 percent of net sales for all respondent
cooperatives. Employee expenses, up 7.2 percent from
1994, represented the smallest increase of all the major
expense categories.
As a percent of net sales, employee expenses
decreased as cooperative size increased. This expense
decreased from 9.2 percent of net sales for small coop-
eratives to 4.6 percent for super cooperatives. By type,
employee expenses as a percent of net sales were 9.6
percent for farm supply cooperatives and 3.4 percent
for marketing cooperatives.
About 62 percent of the cooperatives (268) pro-
vided employee numbers and expenses (table 13).
These expenses were for all employees. To equate part-
time to full-time employees for purposes of this study,
four part-time employees were considered as one full-
time equivalent employee.3 Based on that calculation,
the expense for a single employee averaged $30,119 for
an average 19 employees, up 4 percent from 1994. By
size, they ranged from $26,982 for small to $33,010 for
super cooperatives and by type from $27,611 for those
selling only farm supplies to $33,481 for mixed market-
ing cooperatives. Small cooperatives averaged 8 actual
full-time employees (excludes part-time), medium, 16;
3
Based on previous research conducted by CS economist David E.
Cummins.

Table
wCalculated
salaries (using both full- and part-time employee expenses) and actual number of
full-
time employees, 1995
Small
Medium
Large
Super
All
Farm supply salaries
number of employees
$26,349
9
$31,151
21
$28,391
44
$30,600
42
$27,611
14
Mixed farm supply salaries
28,144
31,452 32,324
33,394
31,596
number of employees
9 18 34
59
28
Mixed marketing salaries
31,568 31,704 34,832
34,106
33,481
number of employees
6
11
20
50 25
Marketing salaries
29,634 29,268
32,443
31,864 31,213
number of employees
4
6
11
39 19
All salaries
26,982
31,039 32,634 33,010
30,119
number of employees 8 16
24
47
19
Table
I.+Board member
SalarieS
Cooperative type Salaries
Cooperative size
Salaries
Farm supply
$576
Mixed farm supply
1,087
Mixed marketing
559
Marketing
739
Average of all
684
Small
$364
Medium
639
Large
870
Super
1,306
large, 24; and super, 47. Farm supply cooperatives
averaged 14 employees, mixed farm supply, 28; mixed
marketing, 25; and marketing, 19.
Cooperatives with a significant proportion of
their sales as farm supplies tended to be more labor
intensive. Operating a feed mill or service station,
applying chemicals and fertilizers, and selling hard-
ware required the use of several employees. For
instance, a small farm supply cooperative had 9 full-
time employees while a small marketing cooperative
used fewer employees-often only a manager, book-
keeper, and two others.
Administrative Expenses
Administrative expenses were indirectly related
to generating income. Managers usually had more con-
trol over administrative expenses than any other cost.
In years when revenues were down, managers could
reduce expenses in this area more easily than in other
categories. Administrative costs include professional
services, donations, dues and subscriptions, directors’
fees and expenses, annual meetings, meetings and
travel, office supplies, and telephone and market infor-
mation.
Professional services (such as legal, accounting,
and computer) and office supplies both comprised 0.16
percent of net sales-the largest administrative
expense. In total, administrative expenses were less
than 0.6 percent of net sales. These expenses fell from a
high of 1.1 percent for small cooperatives to 0.44 per-
cent for super cooperatives. As cooperative size
increased, the highest administrative expense, profes-
sional services, fell as the cooperative relied more on
its own employees to perform these tasks rather than
purchase the services.
Although directors’ fees and expenses were a
small part of total costs, director compensation was
important to many cooperatives to get farmers to sacri-
fice time normally spent on their own operations to
devote several hours of service each month to guiding
their cooperative. Table 14 shows the number of direc-
tors and their compensation for 282 cooperatives in
1995. Board expenses seemed rather modest, averaging
$684
per director. The average board had seven direc-
tors. By size, small cooperatives paid directors the
least ($364) and super paid the most ($1,306). By type,
mixed farm supply cooperatives paid the most at
$1,087 per director.
15

General Expenses
General expenses were usually fixed in the short
run and associated with income production. These
expenses included advertising and promotion, deliv-
ery (auto and truck), general insurance, property, busi-
ness and other taxes and licenses, rent and lease
expenses, plant supplies and repairs, repairs and main-
tenance, utilities (including dryer expenses), miscella-
neous, and other. Most of these expenses (with the
exception of advertising and promotion) were not
under direct management control.
General expenses averaged 3.8 percent of net
sales in 1995, Repairs and maintenance and delivery
expenses at 0.68 percent of net sales were the largest in
the general category, followed by insurance and utili-
ties, both at 0.49. By cooperative size, general expenses
were 4.4 for small cooperatives and 3.4 for super coop-
eratives. By cooperative type, these expenses were
around 5 percent of net sales for farm supply coopera-
tives and around 3 for marketing cooperatives.
Depreciation, Interest, and Bad Debts
Depreciation expense averaged 1.5 percent of net
sales; interest, 0.9 percent; and bad debts, 0.1 percent.
By cooperative size, depreciation expense as a percent
of net sales was 2.1 percent for small cooperatives and
1.5 percent for super cooperatives. By cooperative
type, depreciation expense was 2.2 percent of net sales
for farm supply cooperatives, 1.5 percent for mixed
marketing, and 1.2 percent for marketing cooperatives.
As discussed earlier, interest expenses, especially
for short-term borrowing increased dramatically, going
from 0.7 percent of net sales in 1994 to 0.9 percent in
1995. Interest expenses were lowest among small coop-
eratives at 0.7, but grew to more than 1 percent for
super cooperatives. By type, interest expenses were
about 0.9 percent for all cooperatives except mixed
farm supply which was highest at 1.1 percent.
Bad debts as a percent of net sales fell as coopera-
tive size increased-O.2 for small cooperatives and 0.1
for super cooperatives. By cooperative type, bad debts
were 0.2 for both farm supply cooperatives and
around 0.1 for both marketing cooperatives.
Local Savings
Local savings or local income was generated from
own operations (before taxes and patronage refunds
from other cooperatives). Local savings as a percent of
net sales was highest for small cooperatives (1.6 per-
cent) and lowest for super cooperatives (1 percent). By
type, local savings was the highest for farm supply
cooperatives (1.9 percent) and the lowest for market-
ing cooperatives (0.8 percent). Small cooperatives, and
especially farm supply cooperatives, had higher local
savings than larger marketing cooperatives.
About 24 percent of the cooperatives in this study
had losses. While small cooperatives have higher
returns on net sales, 50 or one-third of them lost
money. Table 15 shows losses by size and type. Thirty
percent of the mixed farm supply cooperatives lost
money. Most likely to lose money were small mixed
farm supply cooperatives (57 percent).
Patronage Refunds Received
Patronage refunds received or income from other
cooperatives resulted from locals doing business with
other cooperatives, generally regionals, or cooperative
banks such as CoBank or the Bank for Cooperatives.
The patronage refund from regionals was based
on business volume and consisted of cash refunds and
equity stock. The equity stock was usually revolved
back to the local cooperative on a set schedule. Many
respondent cooperatives also borrowed funds from
CoBank and the Bank for Cooperatives and received
both cash and noncash patronage income. The noncash
Table
k-Respondent cooperatives that had losses
Cooperative type
Farm supply
Mixed farm supply
Mixed marketing
Marketing
Average
16
Small
28.69
57.14
25.00
50.00
32.05
Cooperative size
Medium
Large
Pefcerrf
10.81
10.53
26.09 18.18
21.43 24.24
26.67 29.17
19.42 21.43
Super
33.33
27.27
6.67
16.13
14.67
Average
23.20
30.00
18.45
25.64
23.61

patronage from CoBank or the Bank for Cooperatives
was from investing in the bank which was usually
required in proportion to the funds borrowed.
Patronage refunds reflect the volume of business
with regional cooperatives, CoBank or the Bank for
Cooperatives. The dollar amount of patronage refunds
between 1994 and 1995 was up 37 percent, suggesting
1995 must have been a good year for regional coopera-
tives, CoBank, or the Bank for Cooperatives. Patronage
refunds received were 2.4 percent of net sales for small
cooperatives and 1.1 percent for super cooperatives. By
cooperative type, patronage refunds received as a per-
cent of net sales were higher for farm supply coopera-
tives than for marketing cooperatives.
Patronage refunds were an important source of
revenues. They allowed 71 (out of 102) cooperatives
that had local losses to have net income.
Income Taxes
Cooperatives paid income taxes on earnings not
allocated to members (retained earnings) and on divi-
dend payments. The decision as to what amounts of
income that were allocated to retained earnings and to
members was made by the board of directors. The
treatment of nonmember business has an impact on
retained earnings because the cooperative could allo-
cate the earnings to nonmembers or retain the income.
In terms of net sales, income tax paid was 0.3 percent
of net sales in 1995.
Income tax paid by cooperatives varied by size
and type. Small cooperatives paid income taxes equal
to 0.2 percent of their net sales, medium, 0.4; large, 0.5;
and super, 0.2. All cooperatives except mixed market-
ing
(
0.5 percent) paid 0.2 percent of their net sales in
income taxes.
Net Income
Net income is the term used here for profits on
cooperative income statements. Net income as a per-
Table
w-Distribution of net income before taxes
Item
1995 1994
Percent
Non-cash patronage allocations 52.91 54.43
Cash patronage refunds
22.42
22.51
Retained earnings
17.17
16.97
Taxes
7.35
5.96
Dividends
-15
.14
cent of net sales decreased by cooperative size. For
small cooperatives it was 3.7 percent of net sales,
medium, 3.1 percent; large, 2.5 percent; and super, 2
percent. By cooperative type, farm supply had returns
of 4.1 percent on net sales, mixed farm supply had 3.2
percent, mixed marketing cooperatives, 2.1 percent,
and marketing cooperatives, 1.5 percent.
Net income (before taxes) was generally distrib-
uted five ways-non-cash patronage allocations, cash
patronage refunds, retained earnings, income taxes,
and dividends on patron’s equity (table 16). Nearly 53
percent of net income before taxes was held as non-
cash patronage allocations by the 287 cooperatives that
provided income allocations. Cash patronage refunds
were 22 percent. All distributions of income were basi-
cally unchanged from 1994. Only 9 of the 287 coopera-
tives reported dividends on preferred stock. The effec-
tive interest paid was 3.22 percent.
Financial Ratio Analvsis
Looking beyond levels of assets, liabilities, mem-
ber equities, sales, and expenses, cooperative man-
agers and boards of directors need comparative mea-
sures to evaluate their cooperative’s financial
performance.
Standard ratios were used in this report, includ-
ing financial ratio analysis that allow performance
comparisons between years and different cooperatives.
No single financial indicator will provide enough
information to determine a cooperative’s financial
health. Therefore, ratios must be carefully interpreted.
It is important to look at a group of financial ratios
over a period of time, evaluate other cooperatives with
similar sales and functions, and/or compare perfor-
mance with other cooperatives in the same geographi-
cal area.
Ratios used in this study were often chosen
because of their comparability with prior studies.
Therefore, most figures show ratios for the 11-year
period for all 1,610 cooperatives. Data for 1994 and
1995 reflect information gathered from the same 432
cooperatives that reported for both years.
Performance ratios measure various levels of
cooperative operations and generally have both a
financial and operational impact. Four categories were
used-liquidity, leverage, activity, and profitability.
Many factors underlie each ratio and examining one
ratio may not help pinpoint problems.
Net income before taxes:
Number of cooperatives:
$101,171,588
$94,112,032
287
330
17

Liquidity Ratios
Liquidity ratios, such as current and quick, mea-
sure the cooperative’s ability to meet short-term oblig-
ations. They focus on the cooperative’s ability to
remain solvent. The current ratio is current assets
divided by current liabilities. However, this ratio does
not consider the degree of liquidity of each of the com-
ponents of current assets. In other words, if the current
assets of a cooperative were mainly cash, they would
be much more liquid than if comprised of mainly
inventory.
If the ratio is less than 1, current liabilities exceed
current assets and the cooperative’s liquidity is threat-
Figure
i-Current and Quick Ratios
Ratio
21
4-=-
Quick
0
’
I
I I I I
I
I
I
I
1985
86
87
88 89
90
92
93 94 95
ened. Improvements in this ratio can be achieved by
selling additional capital stock, borrowing additional
long-term debt, or disposing of unproductive fixed
assets and retaining proceeds. Current liabilities may
also be reduced by retaining a greater portion of allo-
cated savings (reducing the cash portion).
A high current ratio is a favorable condition
financially because it indicates the ability to pay cur-
rent liabilities from the conversion of current assets
into cash. Operationally, this same high ratio tends to
increase operating freedom and reduce the probability
of bill-paying difficulty from writedowns of accounts
receivable or inventory.
Figure 1 shows the current and quick ratios for the
surveyed cooperatives. The current ratio was relatively
constant for 3 years before it took a slight downturn in
1995. The total current assets increased 24 percent
while total current liabilities increased 33 percent.
From 1994 to 1995, grains and oilseeds and farm sup-
ply inventories and dividends on equity were the only
elements of current liabilities that grew. Higher grain
and oilseed inventories are probably causing the
32-
percent increase in patron credit balances and other
liabilities (which contains grain trade payables).
The current ratio fell as cooperative size increased.
The ratio was highest for small cooperatives (2.11) and
fell to 1.19 for super cooperatives (table 17). By cooper-
ative type, the ratio was 1.15 for marketing coopera-
tives and 1.82 for farm supply cooperatives (table 18).
Quick ratio is current assets minus inventories,
divided by current liabilities. Inventories are exclud-
ed-the least liquid of all current assets. All elements
of this ratio have increased. Financially, a high ratio
Table
w-Financial
SnalySiS
ratios
by
COOperatiVe
Sk?,
1995
Ratio
Liquidity
Current
Quick
Leverage
Debts-to-assets
Debt-to-equity
Times-interest-earned
Activity
Total-asset-turnover
Fixed-asset-turnover
Profitability
Gross profit margin
Return on total assets
before interest
&
taxes
Return on allocated equity
Small
Medium
Large Super
2.11 1.63 1.34
1.19
1.12 .80 .56
-41
.12
.19
.24 .32
.06
.ll
.14
.17
6.80 5.26 4.33 3.10
1.78 1.97 2.19 2.28
8.03 7.99 8.53
9.61
15.64 12.34 10.92 8.02
8.20 8.54
8.51
7.29
12.23 13.34 13.83 14.92
18

allows little dependence on the salability of inventory
to meet current obligations. Operationally, the results
are the same as with current ratio.
The quick ratio mimicked the movement of the
current ratio. Small cooperatives (1.12) had the highest
ratio and it decreased as size increased to 0.41 for
super cooperatives (table 17). The quick ratio ranged
from a low of 0.39 for marketing cooperatives to a high
of 0.92 for farm supply cooperatives. This ratio was
highest in 1986 and lowest in 1995 (figure 1).
Figure
z-Total
Debt-To-Asset Ratio
Percent
0.35
0.25
0.20
0.15
0.10
0.05
n
”
1985 86 87 88 89 90 92 93 94 95
Leverage Ratios
Leverage ratios look at the long-term solvency of
the cooperative. They help to analyze the use of debt
and the ability to meet obligations in times of crisis.
Debt-to-asset ratio is defined as total debt divided by
total assets. Elements of this ratio include long-term
debt plus short-term debt and total assets. Long-term
debt increased at the same rate as total assets, which
may indicate some short-term obligations were being
carried and converted to long-term debt. With invento-
ries increasing in the short term, quick financing is
needed, usually through the use of short-term debt.
In fact, short-term debt increased 72 percent
between 1994 and 1995 (table 5). Lenders would rather
see a low ratio indicating the cooperative’s ability to
repay the loan. Overall, this ratio increased from
.21
to
.27
because assets increased by 17 percent while debt
increased by almost one-half (figure 2). Reducing debt,
increasing savings, or financing a greater portion of
assets with working capital may improve this ratio.
Larger cooperatives were financing more of their
assets with debt, but the highest ratio for any size or
type of cooperative was still only 0.32 (table 17). Small
cooperatives had the lowest use of debt at 0.12. Debt
usage was highest for marketing cooperatives at 0.32.
This was twice the ratio for farm supply cooperatives.
By type, farm supply cooperatives had the lowest use
of debt.
Debt-to-equity ratio is calculated by dividing
long-
term debt by member equity. This ratio shows the
financial flexibility and the long-term capital structure
of the cooperative. High ratios indicate inadequate
borrowing power of the cooperative. Debt-to-equity
Table w-financial
analysis
ratios
by
Cooperative
type, 1995
Ratio
Liquidity
Current
Quick
Leverage
Debts-to-assets
Debt-to-equity
Times-interest-earned
Activity
Total-asset-turnover
Fixed-asset-turnover
Profitability
Gross profit margin
Return on total assets
before interest &taxes
Return on allocated equity
Farm
Mixed farm
SUPPlY SUPPlY
1.82
1.41
.92
.62
.16
.27
.ll
.14
6.04 4.13
1.81
1.87
7.25 7.06
16.68 14.94
9.27 8.42
14.06 13.35
Marketing
1.15
.39
.32
.18
2.81
2.42
10.49
5.98
6.35
13.51
Mixed
marketing
1.28
-48
.28
.13
3.73
2.32
9.83
8.18
8.09
14.65
19

ratio increased from 0.12 in 1994 to 0.14 in 1995 (figure
3
&
table 19). A low ratio is more favorable and finan-
cially impacts the cooperative through independence
on outside sources of funds relative to owners’ equity.
A low ratio may also have an unfavorable impact indi-
cating low return on equity. Operationally, a low ratio
tends to reduce interest cost. Improvement may be
gained by reducing long-term debt by disposing of
unproductive assets and using proceeds to liquidate
debt, or accelerating payments on long-term loans.
Other ways include increasing local equity by generat-
ing higher levels of local savings, slowing down equity
retirement programs, selling additional capital stock,
or retaining a greater portion of allocated savings.
As cooperative size grew, so did their use of long-
term debt. The ratio for small cooperatives was 0.06
Table
w-Financial analysis ratios for all cooperatives,
1995and1994
Ratio 1995
1994
Current
1.32
1.41
Quick
0.52
0.65
Debts-to-assets
0.27
0.21
Debt-to-equity
0.14
0.12
Times-interest-earned
3.65 4.65
Total-asset-turnover
2.16 2.34
Fixed-asset-turnover
6.93
8.83
Gross profit margin
9.94
10.13
Return on total assets before
interest &taxes
8.04
8.66
Return on allocated equity
13.96
12.65
Figure
%--Debt-To-Equity Ratio
Percent
0.35
0.30
0.25
1985 86 67 88 89 90 92 93 94 95
20
and 0.17 for super cooperatives (table 17). Marketing
cooperatives had, at 0.18, the highest ratio by type,
while farm supply cooperatives were the lowest at
0.11. When looking at the trend, the ratio increased
slightly each year from 1992 to 1995, but is much lower
than prior years (figure 3).
Times-interest-earned
ratio
is the number of times
interest expense is covered by earnings. It is calculated
by dividing earnings before interest and taxes by inter-
est expense. A ratio of one or more indicates the ability
of current earnings to pay current interest expenses.
Lending institutions are more apt to loan to coopera-
tives whose times-interest-earned ratio is more than
one
(1)
because it shows their ability to pay interest
payments. Subsequently, a lending institution may
lend funds at lower rates more readily for capital
improvements.
Times-interest-earned ratio was higher for
respondent cooperatives in 1993 before starting a
slight downward trend for the next 2 years (figure 4).
This ratio may be improved by collecting old receiv-
ables, improving inventory turnover, disposing of
assets and reducing debt with proceeds, or reducing
debt with working capital. Financially, a high ratio
impacts the return on equity and tends to increase it.
Over time operationally, a high ratio will reduce inter-
est cost.
Interest coverage was the greatest for smaller
cooperatives and generally fell as cooperative size
increased to super cooperatives (table 17). By coopera-
tive type, the ratio ranged from 2.81 for marketing to
6.04 for farm supply.
Figure
4-Times-interest-Earned Ratio
Ratio
”
1985 86 87 88 89 90 92 93 94 95
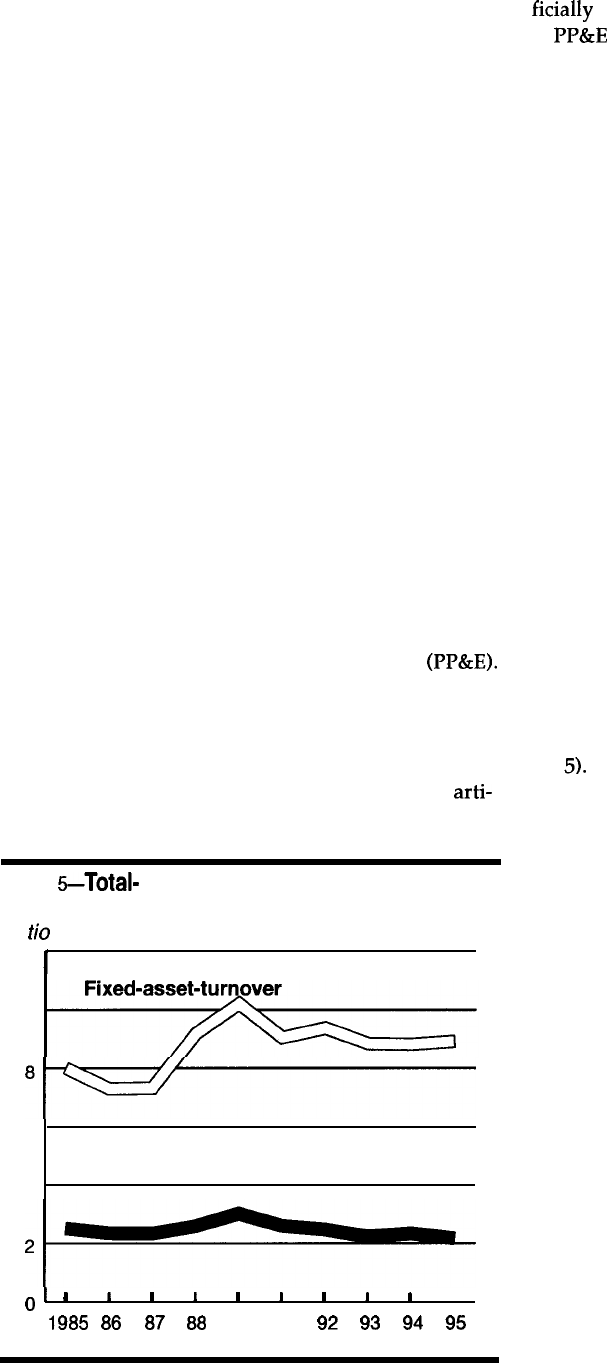
Activity Ratios
Activity ratios measure how well cooperatives
use assets. A low ratio could mean that the cooperative
was overcapitalized or carrying too much inventory. A
high ratio could be deceptive. A cooperative with fully
depreciated older assets could have an artificially high
ratio even though those assets were no longer operat-
ing efficiently.
Total-asset-turnover ratio was found by dividing
net sales by total cooperative assets. This ratio has
gone down slightly from 2.34 in 1994 to 2.16 in 1995
(figure 5). Both elements of this ratio increased-total
sales by 8 percent and total assets by 17 percent. A
high ratio exerts a favorable financial influence
through the reduction of financial leverage and/or
increased return on equity. A high ratio operationally
tends to reduce interest costs.
The ratio was higher for larger cooperatives
(table 17). Super cooperatives had the highest ratio at
2.28, indicating the most efficient use of assets. By
cooperative type, the total asset turnover ratio was
higher for marketing than farm supply. The total asset
turnover ratio was lowest in 1995 at 2.16 and highest
in 1989 at 3.01.
Fixed-asset-turnover ratio represents net sales
divided by net property, plant, and equipment (PP&E).
This ratio is similar to the total asset turnover ratio and
shows how well the cooperative is using its fixed
assets. This ratio by itself might not give a complete
picture of the cooperative’s financial health. A cooper-
ative with fully depreciated assets would have an arti-
Figure
ti--Total-
and Fixed-Asset-Turnover
Ra
tie
12
1
10
“I
6
Total-asset-turnover
4
2-
0’
’
I
I
1
I
I
I
I I
I
1985 a6 a7
88
a9
90
92
93
94
95
ficially high ratio. A cooperative that invested heavily
in PP&E for future expansion will have a temporarily
low ratio.
After a high in 1989 of 10.20, this ratio has
remained relatively level for the 1990s. In 1995, the
ratio was 8.93 and increased slightly from 1994
because sales increased 8 percent while investment in
fixed assets increased 7 percent. The measure for this
ratio may or may not show favorable or unfavorable
conditions. It simply reflects cooperative conditions.
An abnormally high ratio usually indicates very old,
nearly depreciated fixed assets or the leasing of prop-
erty and equipment.
A high ratio financially exerts a favorable influ-
ence by increasing asset use, reducing financial lever-
age, and/or increasing return on equity. A high ratio,
operationally, tends to reduce depreciation and interest
costs. It may also increase costs related to operating
leases, personnel and travel or delivery expenses. This
ratio may be improved by restricting further invest-
ments in fixed assets; redesigning production, or office
facilities to increase the sales generating potential of
existing space and equipment; and/or selling idle
machinery and parts, unused vehicles, and unneces-
sary equipment.
By size, a fixed-asset-turnover ratio of 9.61 was
greatest for super cooperatives. By type, the ratio was
the highest (10.49) for marketing cooperatives. The
fixed-asset-turnover ratio was at its lowest in 1987 (fig-
ure
51.
Profitability Ratios
Profitability ratios, such as gross profit margin,
indicate the efficiency of the cooperative’s operations.
Because a cooperative is owned by its user-members,
many common industry profitability ratios have little
meaning. For instance, profitability ratios measuring
the return on common or preferred stock of similar
investor-oriented firms are not appropriate because
there is seldom an open market for cooperative stock.
Gross profit margin is found by subtracting the
cost of goods sold from, net sales and then dividing
this amount (gross margin) by net sales. The gross
profit margin is an important operating ratio. A small
change in the gross margin has a tremendous impact
on local savings. It indicates the cooperative’s pricing
policy and cost of goods offered for sale.
For all cooperatives, the gross profit margin aver-
aged 9.94 percent in 1995. The gross profit margin was
the highest for respondent cooperatives in 1993 at
10.76 percent (figure 6). By size, gross profit margin
diminished as cooperative sales grew. At 15.64 percent,
21
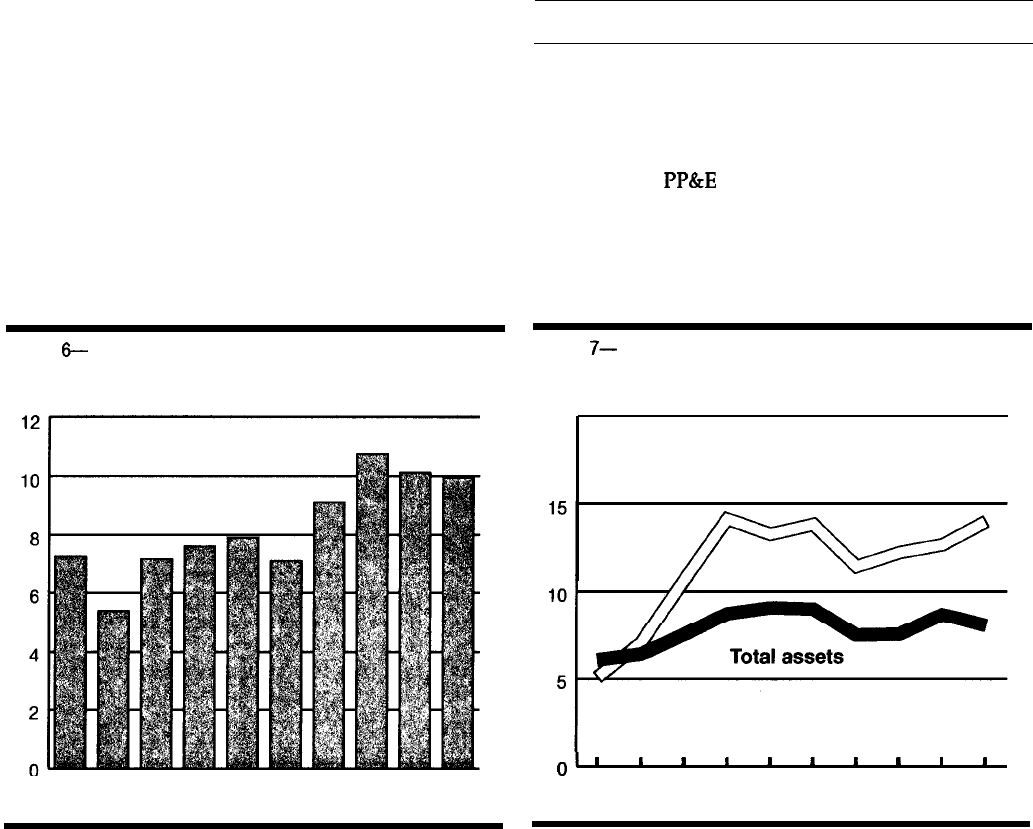
small cooperatives had the highest gross margin. By
type, farm supply and mixed farm supply coopera-
tives, at 16.68 percent and 14.94 percent, had the high-
est margins in 1995 (table 18).
Return on total assets measures the rate of return
on total investment. It is calculated by dividing net
income by total assets and usually calculated before
interest and taxes. This ratio is a measure of perfor-
mance. It is not sensitive to the leverage position of the
cooperative. Although some assets were financed
through debt, the ratio measures return to both mem-
bers and lenders. This ratio declined by 0.62 percent to
8.04 percent between 1994 and 1995 (table 19).
Net savings (before income taxes) declined 1 per-
cent while interest expense increased 42 percent dur-
ing the 2-year period (table 9). For the decade, this
ratio was highest in 1992 and 1995 and has been fairly
constant (figure 7). Operationally, a high ratio tends to
reduce interest cost and financially indicates a compar-
atively high rate of return on assets employed.
Medium and large cooperatives had a higher
return on total assets (table 17). Medium-sized cooper-
atives were slightly higher at 8.54 percent. By coopera-
tive type, return on total assets was highest for farm
supply cooperatives at 9.27 percent. Assets relative to
revenue were higher for both types of farm supply
cooperatives.
Return on allocated equity is net income divided
by allocated equity. It was determined by subtracting
unallocated equity from total member equities. It rep-
resents member investment in their cooperative and is
an important measure of profitability.
Figure
6-
Gross Profit Margin
Percent
‘*ti
This ratio increased 1 percent in 1995 (table 19).
This ratio is sensitive to the amount of debt capital in
the cooperative and best used in conjunction with
other measures such as the return on total assets. Net
savings increased 14 percent while allocated equity
increased 3 percent from 1994 to 1995.
Financially, a high ratio is favorable and tends to
decrease financial leverage. However, a high ratio may
also be a symptom of low investment adequacy.
Operationally, a high ratio tends to reduce interest cost
over time but may occur when both total debt and
interest costs are on the high side.
By size, this ratio increased as the cooperative
grew in size. Super cooperatives had the highest return
on allocated equity (14.92 percent). Farm supply and
mixed farm supply cooperatives ratios were 14.06 per-
cent and 13.35 percent and marketing and mixed mar-
keting cooperatives were 13.51 percent and 14.65 per-
cent (table 18).
Summary and Conclusions
Local cooperatives studied in this report general-
ly had strong financial statements. Assets increased 17
percent from 1994 to 1995. More than half of the
accounts receivable were less than 30 days old.
Investment in
W&E
grew 7 percent. Owner equities
grew 5 percent and member ownership in the local
exceeds 50 percent. Net sales grew 8 percent. Total
expenses grew 13 percent while net income grew
slightly faster, at 14 percent.
Figure
7-
Return on Total Assets and Allocated
Equity
Percent
20
Allocated
equity
1985 86 87 88 89 90 92 93 94 95
0’
’
I I I I
1
I I
I
I
1985 86
87 88
89
90
92
93 94 95
22
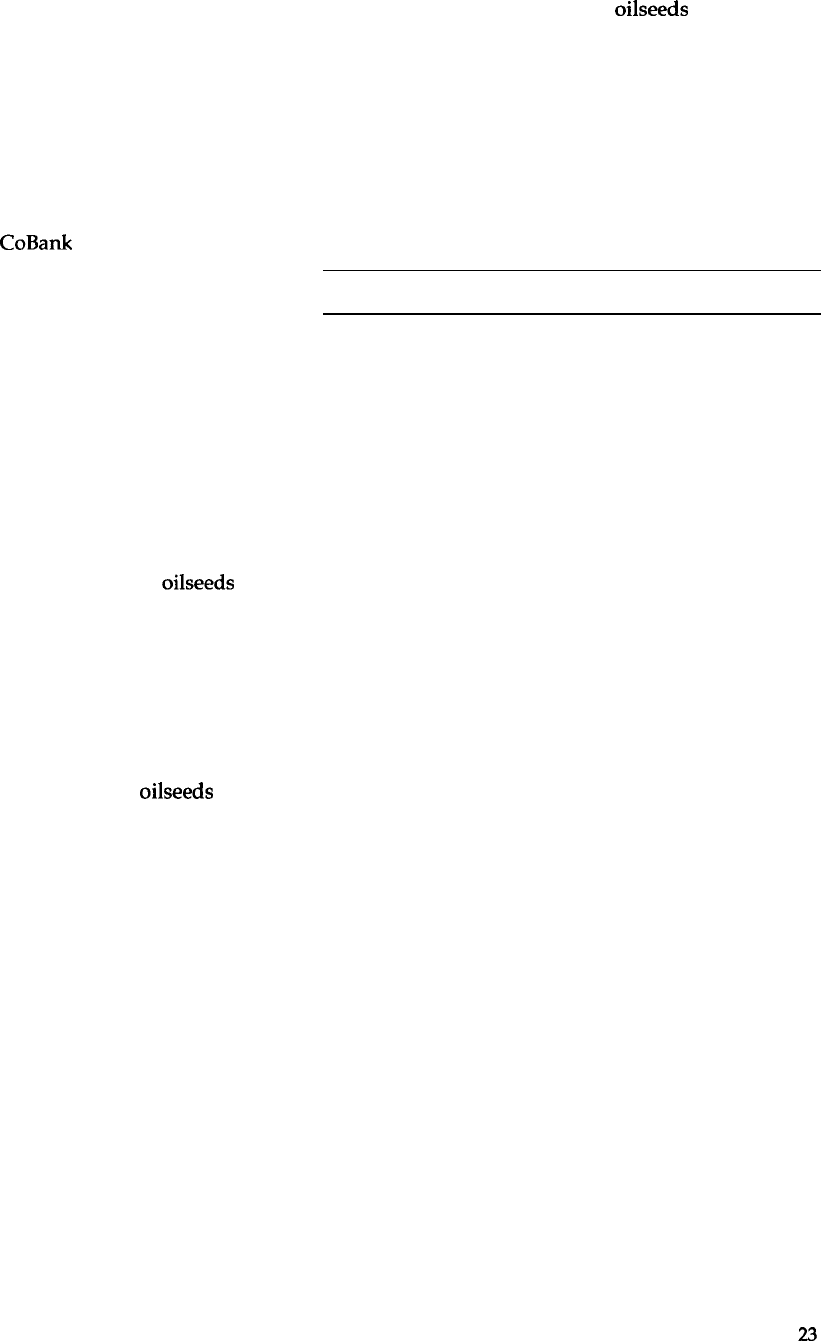
Agricultural cooperatives continue to play a vital
role in supplying goods and services to farmers and
marketing their products. They are also important to
rural communities, often one of the largest employers,
and provide considerable tax revenues. The extensive
consolidation of local cooperatives during the past two
decades reflects attempts to maintain an adequate size
from which to provide their members with expanded
products and markets. Despite consolidation, coopera-
tives studied maintained an average of two branch
locations from which to better serve members.
These cooperatives maintained strong ties to
regional cooperatives, CoBank or the Bank for
Cooperatives through which they obtained products,
gained marketing opportunities, or borrowed needed
capital. Investment in other cooperatives rose 8 percent
from 1994. In turn, patronage refunds to local coopera-
tives from regionals and the banks increased 37 per-
cent and made the year profitable for 71 cooperatives
that would have otherwise had losses. But, local coop-
eratives cannot depend on large patronage refunds
and with numerous locals losing money, further con-
solidation of locals may be necessary in the future.
An area of concern in the financial statements
was the large buildup in inventories and subsequent
increases in short-term debt. Grains and oilseeds
inventories increased 51 percent; short-term debt
climbed 72 percent and pushed up interest costs 42
percent. Inventory buildup and the subsequent growth
in assets financed through additional debt had an
impact on much of the ratio analysis:
1) Liquidity ratios, current and quick, declined slightly
in 1995 due to increased grains and oilseeds and
farm supply inventories;
2) Leverage ratios-debt-to-total assets ratio, jumped
from
0.21
in
1994 to
0.27 in
1995
because assets
increased 17 percent while debt increased almost 50
percent;
3) Activity ratios-total-asset-turnover ratio fell from
2.34 in 1994 to 2.16 in 1995 because total sales
increased only 8 percent while assets increased 17
percent with much of the increase in inventories;
and finally
But increases in inventories are not expected to
be a long-term trend. More current information sug-
gests the inventory problem will be a non-issue in FY
1996. Prices for most grains and oilseeds increased
greatly this past year and most inventories were prob-
ably liquidated to capture the higher prices. Other
pressing issues are sure to arise in the coming year.
Cooperatives are owned by their
farmer/member/patrons. As long as those farmers
want to own a business where they can purchase their
supplies and market their products, cooperatives will
continue to adapt to changing economic conditions.
Bibliography
Chesnick, David S., and E. Eldon Eversull, Analysis of
Income Statements of Local Farm Supply and
Marketing Cooperatives, U.S. Department of
Agriculture, Rural Business-Cooperative Service,
RR 134, November 1994.
Eversull, E. Eldon, and David S. Chesnick, Analysis of
Balance Sheets of Local Farm Supply and
Marketing Cooperatives, U.S. Department of
Agriculture, Rural Business-Cooperative Service,
RR 138, January 1.
4) Profitability ratios-return on total assets ratio fell
from 8.66 in 1994 to 8.04 in 1995 because total assets
increased more than net income. Total assets reflect-
ed increased inventory while increased interest costs
lowered net income.
23

Appendix table
l-Common size balance sheets for farm supply cooperatives, 1995
Cooperative size
Item
Small Medium Large
Super
Assets
Current assets
Cash and cash equivalents
Accounts receivable
Inventories-rains and oilseeds
-farm supplies
Prepaid expenses
Other current assets
Total current assets
Investments and other assets
Investments-other cooperatives
-Bank for Cooperatives
-Total
Other assets
Total investments
&
other assets
Property, plant, and equipment
At cost
Less accumulated depreciation
Net
PP&E
Total assets
Liabilities and owner equities
Current
liabilities
Current portion of long-term debt
Notes payable-seasonal
Accounts payable
Patrons credit balances
&
other liabilities
Accrued taxes
Accrued expenses
Patronage refunds (cash)
Total current liabilities
Long-term debt
Total liabilities
Owner equities
Allocated equity
Unallocated equity
Total owner equities
Total liabilities and owner equities
Percent
of
total
assets
7.59
4.39 3.92
2.91
12.94 14.97 14.55
7.17
22.67
23.01
21.99
30.22
2.51
.96
1.94
4.76
2.24
3.45
.60
9.07
47.95 46.80 43.20
54.15
27.83
25.80 23.46
18.91
34
.67
1.42
.29
28.17 26.47
24.88
19.20
1.08
1.91
4.17
84
29.25 28.38 29.05
20.04
57.81
59.84 58.88
59.79
35.01
35.02 31.13
33.98
22.80 24.82 27.75
25.81
100.00
100.00
100.00
100.00
1.87 1.75 2.51
1.94
6.45 6.75 6.14
11.33
6.61
7.25 7.92
14.26
4.61
6.00 3.68
11.65
.42
.50
.63 .58
1.37
1.58 3.12
.88
1.43
1.52
1.94
1.82
22.76
25.35 25.94
42.46
4.26
8.43 10.87
6.73
27.02
33.78
36.81
49.19
54.86 53.25 51.02
35.46
18.12 12.97 12.17
15.35
72.98
66.22 63.19
50.81
100.00
100.00 100.00
100.00
Based on total assets of:
$1,490,412
$4,063,398
$6,774,303
$1 1 , 165,924
24

Appendix table
2--COfWTIOtI
SiZS
balance sheets for
mixed
fartll
SUpply
cOOp’atiVeZ3,
19%
Cooperative
size
Item
Small
Medium
Large
Super
Assets
Current
assets
Cash and cash equivalents
Accounts receivable
Inventories~rains
and oilseeds
-farm supplies
Prepaid expenses
Other current assets
Percent
of
tote/
assets
3.18
3.12
3.36
2.00
18.06 16.64
15.66
13.49
10.92 12.02
10.92
24.42
13.61
9.97 13.34 12.57
.68
.72 .77
50
5.12
2.86
3.47
4.61
Total current assets
Investments and other assets
Investments-other cooperatives
-Bank for Cooperatives
51.57 45.33
47.51
57.59
26.41
22.85 22.09 15.08
.95
1.82
1.12 1.46
-Total
27.36
24.67
23.21
16.54
Other assets
1.82 1.92
1.23
.96
Total investments
&
other assets
Property, plant, and equipment
At cost
Less accumulated depreciation
29.18
26.59 24.44 17.50
72.87
67.36 72.74
65.31
53.62
39.28
44.70
40.40
Net
PP&E 19.25
28.08 28.04
24.91
Total assets
100.00 100.00
100.00
100.00
Liabilities and owner equities
Current liabilities
Current portion of long-term debt
Notes payable-seasonal
Accounts payable
Patrons credit balances
&
other liabilities
Accrued taxes
Accrued expenses
Patronage refunds (cash)
1.70
3.06 3.45 3.07
9.87 12.20 9.27 24.29
7.70
5.76
6.18
6.66
5.09
5.06 8.47
7.11
.61
.47
.51
.62
1.84
1.51
1.75
2.22
.71
1.28 1.78
1.49
Total current liabilities
Long-term debt
Total liabilities
27.32
29.34
31.41
45.46
6.08
8.86 8.27
7.10
33.40
38.00 39.68 52.56
Owner equities
Allocated equity
Unallocated equity
48.40 49.74
50.18
37.24
18.20
12.28 10.14 10.20
Total owner equities
66.60 62.00
60.32
47.44
Total liabilities and owner equities
100.00 100.00
100.00
100.00
Based on total assets of:
$1,429,714
84,041,710 $7,009,070
$15844,816
25

Appendix table
3-Common
size balance sheets for mixed marketing cooperatives,
1995
Cooperative size
Item
Small
Medium Large
Super
Assets
Current
assets
Cash and cash equivalents
Accounts receivable
Inventories-grains and oilseeds
-farm supplies
Prepaid expenses
Other current assets
Percent
of
total
assets
8.92
5.71
2.00
2.20
14.31
13.14
10.94 9.60
25.66 22.22 26.13 29.07
11.32
9.64 9.95
9.69
.23
.74
.38 .82
7.08 4.87 8.45
9.40
Total current assets
Investments and other assets
Investments-other cooperatives
-Bank for Cooperatives
-Total
Other assets
Total investments
&
other assets
Property, plant, and equipment
At cost
Less accumulated depreciation
67.52 56.32
57.85
60.78
12.30 19.25 15.16
13.75
.18
2.17 1.84
1.56
12.48 21.42 17.00
15.31
1.02 .48
.50
.26
13.50
21.90 17.50
15.57
73.85 81.57 83.27
61.86
54.87 59.79 58.62
38.21
Net
PP&E
18.98 21.78
24.65
23.65
Total assets
100.00
100.00 100.00 100.00
Liabilities and owner equities
Current liabilities
Current portion of long-term debt
Notes payable-seasonal
Accounts payable
Patrons credit balances
&
other liabilities
Accrued taxes
Accrued expenses
Patronage refunds (cash)
1.05
3.24 3.83
3.26
4.44 7.08 18.08 21.74
4.46 5.12
3.61
4.53
19.13 15.57 18.09 15.86
.55 .70
.77
.77
.54 1.35
1.04
1.81
1.15
1.51
.92
1.31
Total current liabilities
31.32
34.57 46.34
49.28
Long-term debt
2.28
3.58 5.64 6.65
Total liabilities
33.60 38.15 51.98 55.93
Owner equities
Allocated equity
Unallocated equity
Total owner equities
46.17
34.99 31.96 32.10
20.23 26.86 16.04 11.97
66.40 61.85 48.02 44.07
Total liabilities and owner equities
100.00
100.00 100.00
100.00
Based on total assets of:
$1,408,731
$2,984,345 $6,190,531 $16,492,384
26

Appendix table d-Common
Size
balance sheets for marketing cooperatives,
1995
Cooperative size
Item
Small Medium Large
Super
Assets
Current
assets
Cash and cash equivalents
Accounts receivable
Inventories-grains and oilseeds
-farm supplies
Prepaid expenses
Other current assets
Percent
of
total
assets
Total current assets
Investments and other assets
Investments-other cooperatives
-Bank for Cooperatives
10.09 6.38 3.38
1.59
3.33 6.44
6.71
7.30
10.71
26.53
33.41
37.35
2.61
3.12
7.06 6.22
1.74 .85
.50
.55
29.22
16.79
12.77
10.49
57.70
60.11
63.83
63.50
19.07
16.10
12.06
10.60
.13 1.43 1.09
1.88
-Total
19.20 17.53 13.15 12.48
Other assets
1.28
.20
.73 .63
Total investments
&
other assets
Property, plant, and equipment
At cost
Less accumulated depreciation
20.48 17.73 13.88
13.11
71.40
69.73 62.73 56.74
49.57
47.57
40.44 33.35
Net
PP&E 21.82
22.16 22.29 23.39
Total assets
100.00 100.00
100.00 100.00
Liabilities and owner equities
Current
liabilities
Current portion of long-term debt
Notes payable-seasonal
Accounts payable
Patrons credit balances
&
other liabilities
Accrued taxes
Accrued expenses
Patronage refunds (cash)
.82
7.59 6.85
3.07
.12
16.73
16.63 22.65
2.43
2.63 8.03 2.82
16.35
16.88 19.22
25.59
.20
.61
.63 .69
.64
.75
1.04
1.06
.59 .82 .78 .72
Total current liabilities
21.15
46.01
53.18
56.60
Long-term debt
.77
5.14 5.12 7.40
Total liabilities
21.92
51.15 58.30 64.00
Owner equities
Allocated equity
Unallocated equity
54.58
30.22
27.81
25.43
23.50 18.63 13.89 10.57
Total owner equities
Total liabilities and owner equities
78.08 48.85 41.70
36.00
100.00
100.00 100.00 100.00
Based on total assets of:
$1
,143,857
$2,647,247
$5,492,362 $16,935,051
27

appendix
table &Abbreviated income Statement as a percent of net Sale8 for farm supply cooperatives, 1995
Cooperative size
Small Medium
Large
Super
Percent of net sales
Net safes 100.00 100.00 100.00 100.00
Cost of goods
sold 82.58 82.87
82.01
90.78
Gross margin
17.42 17.33 17.99 9.22
Service and other income
3.48 4.28 3.78 3.77
Gross revenue
20.90
21.59 21.75
12.99
Expenses
Employee
f
10.09 10.09 10.18 5.59
Administrative
2
1.21 1 .oo
.92
.73
General
3
4.54 5.00 5.00 3.33
Depreciation
2.32
2.40
2.24 1.47
Interest
.73
.98
.92 .73
Bad debts
.20
.27 .18
.08
Total
expenses
19.09 19.72 19.40
11.93
Local savings
1.81
1.87 2.35
1.06
Patronage refunds received
2.72 2.49 2.17
1.60
Savings before income taxes
4.53 4.36 4.52 2.66
Less income taxes
.24
.15 .30
.19
Net income
4.29
4.21
4.22 2.47
Based on sales of:
$2,469,399
$6,737,019 $13,008,043
!$31,582,922
1
Employee expenses include salaries and wages, payroll taxes, employee insurance, unemployment compensation, and pension expense.
*
Administrative costs include professional services, office supplies, telephone, meetings and travel, donations, dues and subscriptions,
directors’ fees and expense, and annual meetings.
3
General expenses include advertising and promotion, delivery (auto and truck), insurance, property, business and other taxes and licenses,
rent and lease expenses, plant supplies and repairs, repairs and maintenance, utilities, miscellaneous, and other.
28

Appendix
table
c-Abbreviated
income statement as a percent of net sales
for
mixed farm supply
COOperatiVeS,
1995
Small Medium
Large Super
P
efcent of net sales
Net
sales
100.00
100.00
100.00 100.00
Cost of goods
sold
85.12
85.80
83.44 86.13
Gross
margin
14.88
14.20
16.56 13.87
Service and other income
3.76
4.51
5.65
4.81
Gross revenue
18.64
18.71 22.21
18.68
Expenses
Employee
1
Administrative
2
General
3
Depreciation
Interest
Bad debts
Total
expenses
17.99
17.71
20.32 17.34
Local savings
.65
1 .oo
1.89
1.34
Patronage refunds received
1.69
2.10 2.27
1.72
9.41
8.26 10.17
8.00
1.13
1.01
.86 .87
4.61
4.67
5.69
4.99
1.53 2.40 2.39
2.11
83
1.09
1.04
1.18
.48
.28
.17
.19
Savings before income taxes
2.34
3.10
4.16 3.06
Less income taxes
.45
.14
.17
.21
Net income
1.89
2.96
3.99 2.85
Based on sales of:
$1,429,714 $4,041,710
$7,009,070 $15,044,816
1
Employee expenses include salaries and wages, payroll taxes, employee insurance, unemployment compensation, and pension expense.
2
Administrative costs include professional services, office supplies, telephone, meetings and travel, donations, dues and subscriptions,
directors’ fees and expense, and annual meetings.
3
General expenses include advertising and promotion, delivery (auto and truck), insurance, property, business and other taxes and licenses,
rent and lease expenses, plant supplies and repairs, repairs and maintenance, utilities, miscellaneous, and other.
29

Appendix
table
-I-Abbreviated income statement as a percent of net sales for mixed marketing co-ops, 1995
Cooperative size
Small
Medium
Large
Super
Percent of net sales
Net sales
100.00 100.00 100.00 100.00
Cost of goods sold
90.95 91.49 92.12 91.78
Gross margin
9.05
8.51
7.88
8.22
Service and other income
3.27 4.28 4.02
4.01
Gross revenue
12.32 12.79 11.90 12.23
Expenses
Employee
1
Administrative
*
General
3
Depreciation
Interest
Bad debts
Total expenses
Local savings
Patronage refunds received
Savings before income taxes
Less income taxes
Net income
5.38 5.05
4.91
4.78
.62
.55
.42
.42
3.30 2.39
2.47
3.18
1.50
1.51
1.52
1.56
.37 .65
.98
.99
.26
-25
.23
84
11.43
10.40
10.53
10.97
.89
2.39
1.37 1.26
.80 1.28 1.27
1.09
1.69
3.67 2.64 2.35
.12
.96
1
.Ol
.20
1.57
2.71
1.63
2.15
Based on assets of:
$1,408,731
$2,984,345
$6,190,531
$16,492,384
1
Employee expenses include salaries and wages, payroll taxes, employee insurance, unemployment compensation, and pension expense.
2
Administrative costs include professional services, office supplies, telephone, meetings and travel, donations, dues and subscriptions,
directors’ fees and expense, and annual meetings.
3
General expenses include advertising and promotion, delivery (auto and truck), insurance, property, business and other taxes and licenses,
rent and lease expenses, plant supplies and repairs, repairs and maintenance, utilities, miscellaneous, and other.
30

Appendix table
s-Abbreviated income statement as a percent of net
Sales
for marketing
COOperatiVeS,
1995
Cooperative size
Small
Medium Large
Super
Percent of net sales
Net sales
100.00 100.00
100.00 100.00
Cost of goods sold
95.43 95.06
94.59 93.74
Gross margin
Gross revenue
Expenses
Employee
I
Administrative
*
General
3
Depreciation
Interest
Bad debts
Total expenses
Local savings
Patronage refunds received
Savings before income taxes
Less income taxes
4.57
4.94
5.41
6.26
10.40
8.12 8.49
9.93
3.95
2.93
3.13
3.45
.52
.42 .35
.32
3.08 2.12 2.32
3.09
1.33 1.16 1.16
1.21
.29
.52 .66
1.07
.07
.05
.lO
.04
9.24
7.20 7.72
9.18
1.16
.92
.77
.75
1.63
.97 .65
.97
2.79
1.89
1.42
1.72
.05
.46 .16.20
Net income
2.74
1.43 1.26
1.52
Based on sales of:
$1
,143,857
$2,647,247 $5,492,362
$16,935,051
’
Employee expenses include salaries and wages, payroll taxes, employee insurance, unemployment compensation, and pension expense.
*
Administrative costs include professional services, office supplies, telephone, meetings and travel, donations, dues and subscriptions,
directors’ fees and expense, and annual meetings.
3
General expenses include advertising and promotion, delivery (auto and truck), insurance, property, business and other taxes and licenses,
rent and lease expenses, plant supplies and repairs, repairs and maintenance, utilities, miscellaneous, and other.
31
U.S. Department of Agriculture
Rural Business-Cooperative Service
Stop 3250
Washington, D.C. 20250-3250
Rural Business-Cooperative Service (RBS) provides research, management, and
educational assistance to cooperatives to strengthen the economic position of farmers and
other rural residents. It works directly with cooperative leaders and Federal and State
agencies to improve organization, leadership, and operation of cooperatives and to give
guidance to further development.
The cooperative segment of RBS (1) helps farmers and other rural residents develop
cooperatives to obtain supplies and services at lower cost and to get better prices for
products they sell; (2) advises rural residents on developing existing resources through
cooperative action to enhance rural living; (3) helps cooperatives improve services and
operating efficiency; (4) informs members, directors, employees, and the public on how
cooperatives work and benefit their members and their communities; and (5) encourages
international cooperative programs.
FIBS
also publishes research and educational
materials and issues Rural Cooperatives magazine.
The United States Department of Agriculture (USDA) prohibits discrimination in its
programs on the basis of race, color, national origin, sex, religion, age, disability, political
beliefs and marital or familial status. (Not all prohibited bases apply to all programs.)
Persons with disabilities who require alternative means for communication of program
information (Braille, large print, audiotape, etc.) should contact the USDA Office of
Communications at (202) 720-2791.
To file a complaint, write the Secretary of Agriculture, U.S. Department of Agriculture,
Washington, D.C. 20250, or call l-800-245-6340 (voice) or (202) 720-l 127 (TDD). USDA
is an equal employment opportunity employer.
